The Domain Name Industry Brief Quarterly Report
Q2 2023 Data and Analysis
A more recent edition of the Domain Name Industry Brief Quarterly Report is available: Q2 2025
DNIB.com reviews the state of the domain name industry each quarter through a variety of statistical and analytical research, as well as relevant industry insights. DNIB.com provides this report to highlight important trends in domain name registrations, including key performance indicators and growth opportunities, to industry analysts, media and businesses.
Editor's Note: With the launch of the DNIB.com dashboards, 16 additional TLDs have been included in applicable calculations. The applicable current and historical data presented in this edition of the quarterly report have been adjusted accordingly, and applicable quarterly and year-over-year trends have been calculated using those adjusted figures. More information is available in a DNIB.com article.
EXECUTIVE SUMMARY
The second quarter of 2023 closed with 356.6 million domain name registrations across all top-level domains (TLDs), an increase of 1.7 million domain name registrations, or 0.5% compared to the first quarter of 2023. Domain name registrations have increased by 4.3 million, or 1.2%, year over year.
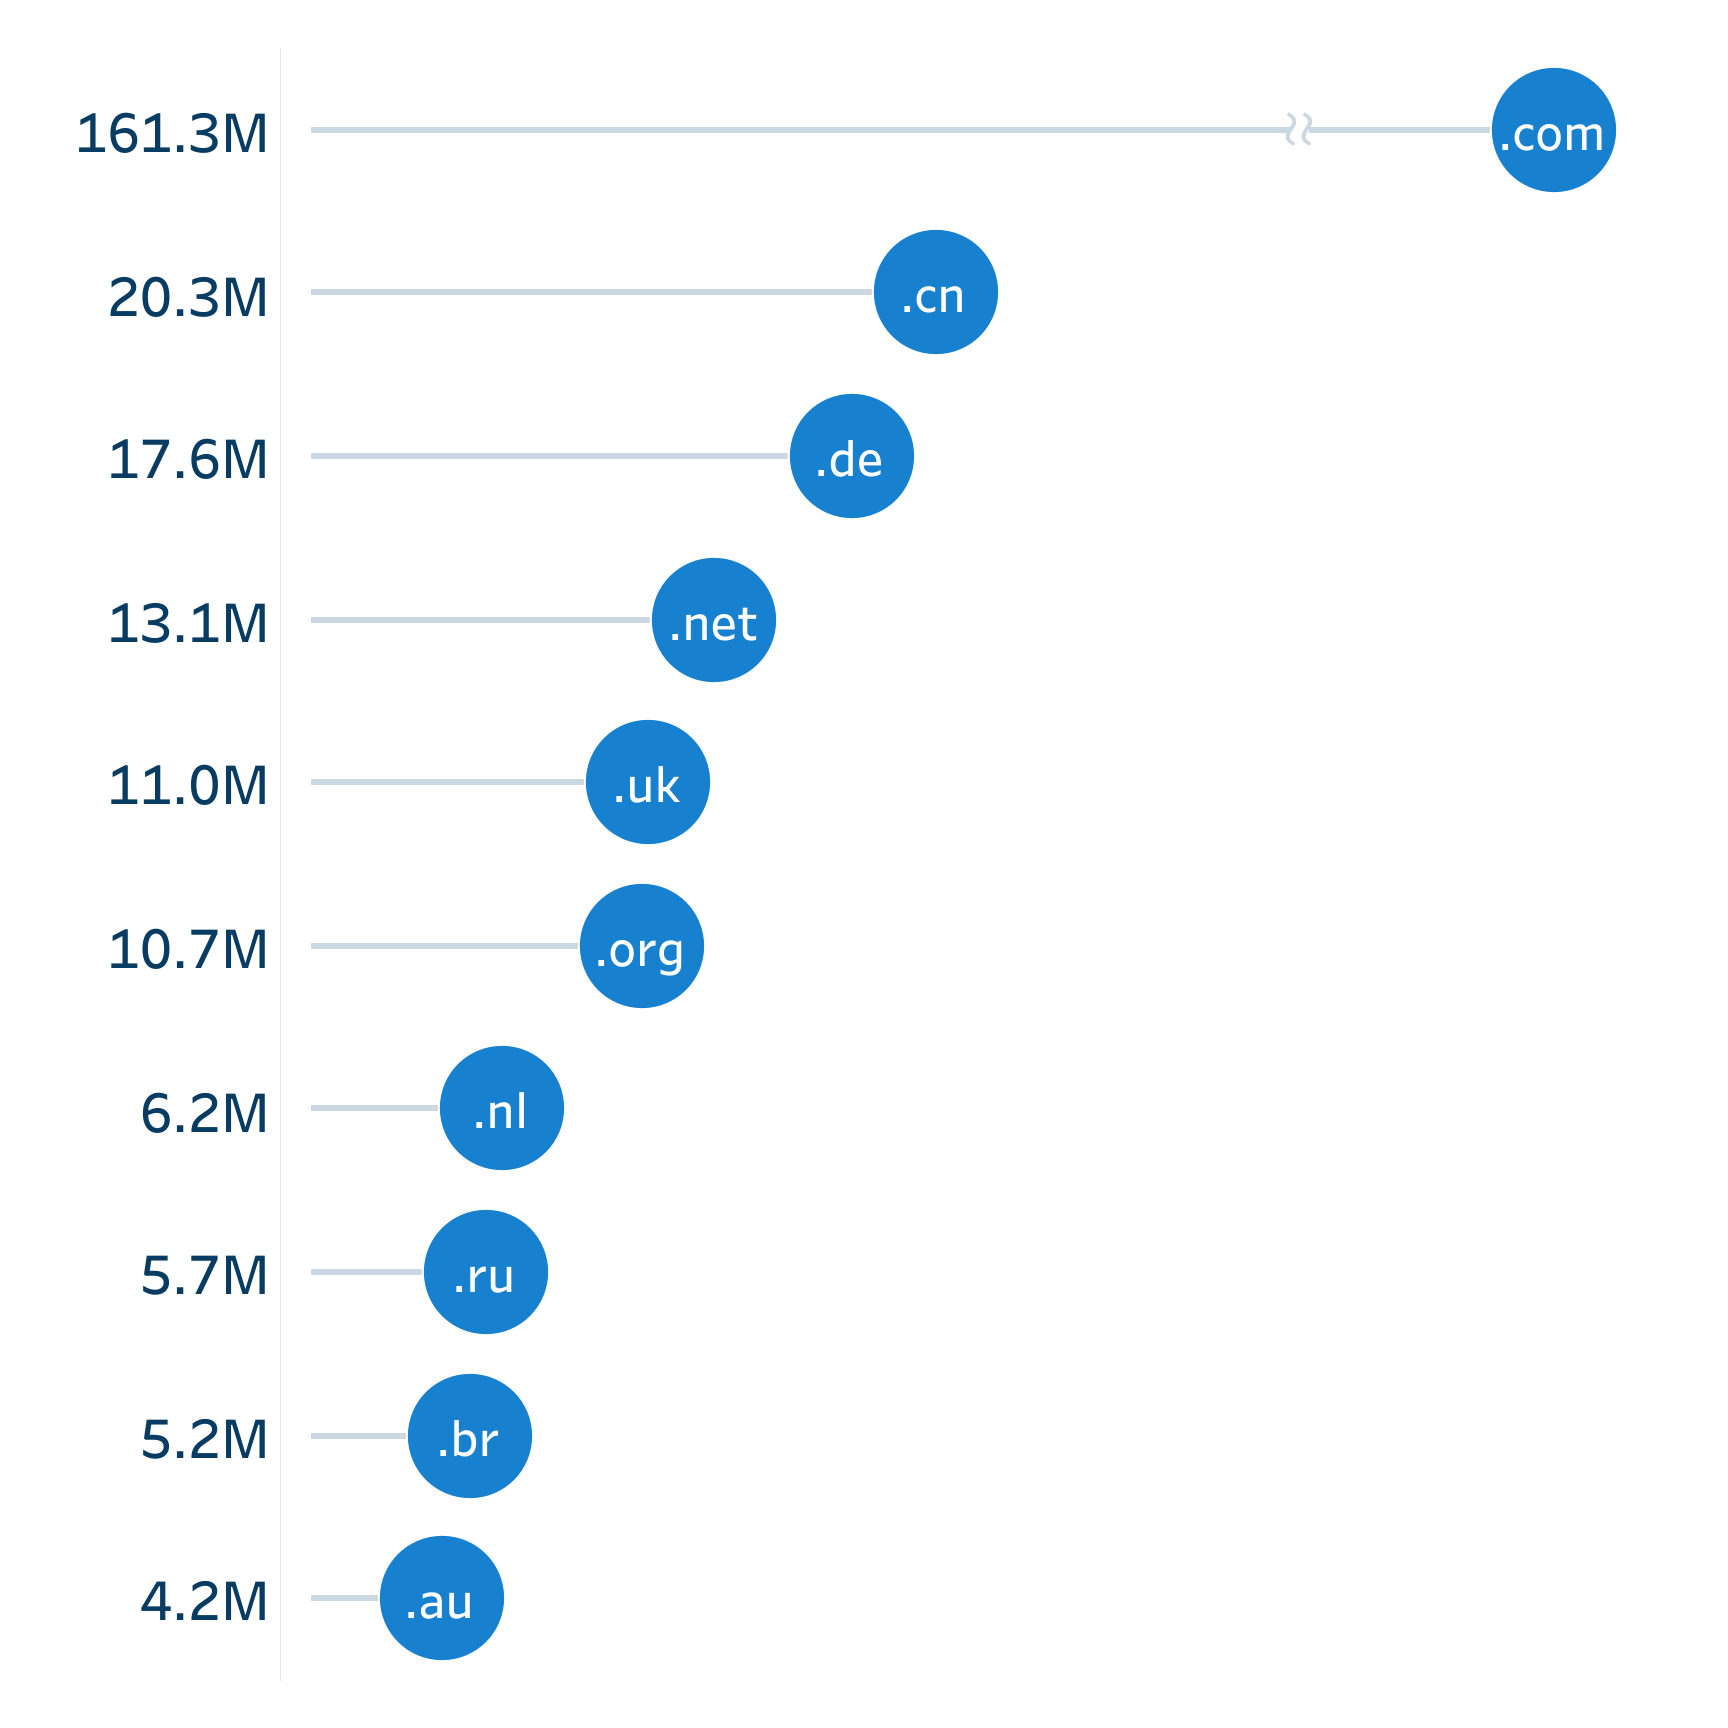
The .com and .net TLDs had a combined total of 174.4 million domain name registrations in the domain name base at the end of the second quarter of 2023, a decrease of 0.3 million domain name registrations, or 0.2%, compared to the first quarter of 2023. The .com and .net TLDs had a combined increase of 0.1 million domain name registrations, or 0.1%, year over year. As of June 30, 2023, the .com domain name base totaled 161.3 million domain name registrations and the .net domain name base totaled 13.1 million domain name registrations.
New .com and .net domain name registrations totaled 10.2 million at the end of the second quarter of 2023, compared to 10.1 million domain name registrations at the end of the second quarter of 2022.
Total country-code TLD (ccTLD) domain name registrations were 137.0 million at the end of the second quarter of 2023, an increase of 1.1 million domain name registrations, or 0.8%, compared to the first quarter of 2023. ccTLDs increased by 2.7 million domain name registrations, or 2.0%, year over year.
Total new generic TLD (ngTLD) domain name registrations were 28.1 million at the end of the second quarter of 2023, an increase of 0.8 million domain name registrations, or 3.0%, compared to the first quarter of 2023. ngTLDs increased by 1.1 million domain name registrations, or 4.0%, year over year.
Top 10 Largest TLDs by Number of Reported Domain Names
As of June 30, 2023, the 10 largest TLDs by number of reported domain names were .com, .cn, .de, .net, .uk, .org, .nl, .ru, .br and .au.
Top 10 Largest ccTLDs by Number of Reported Domain Names
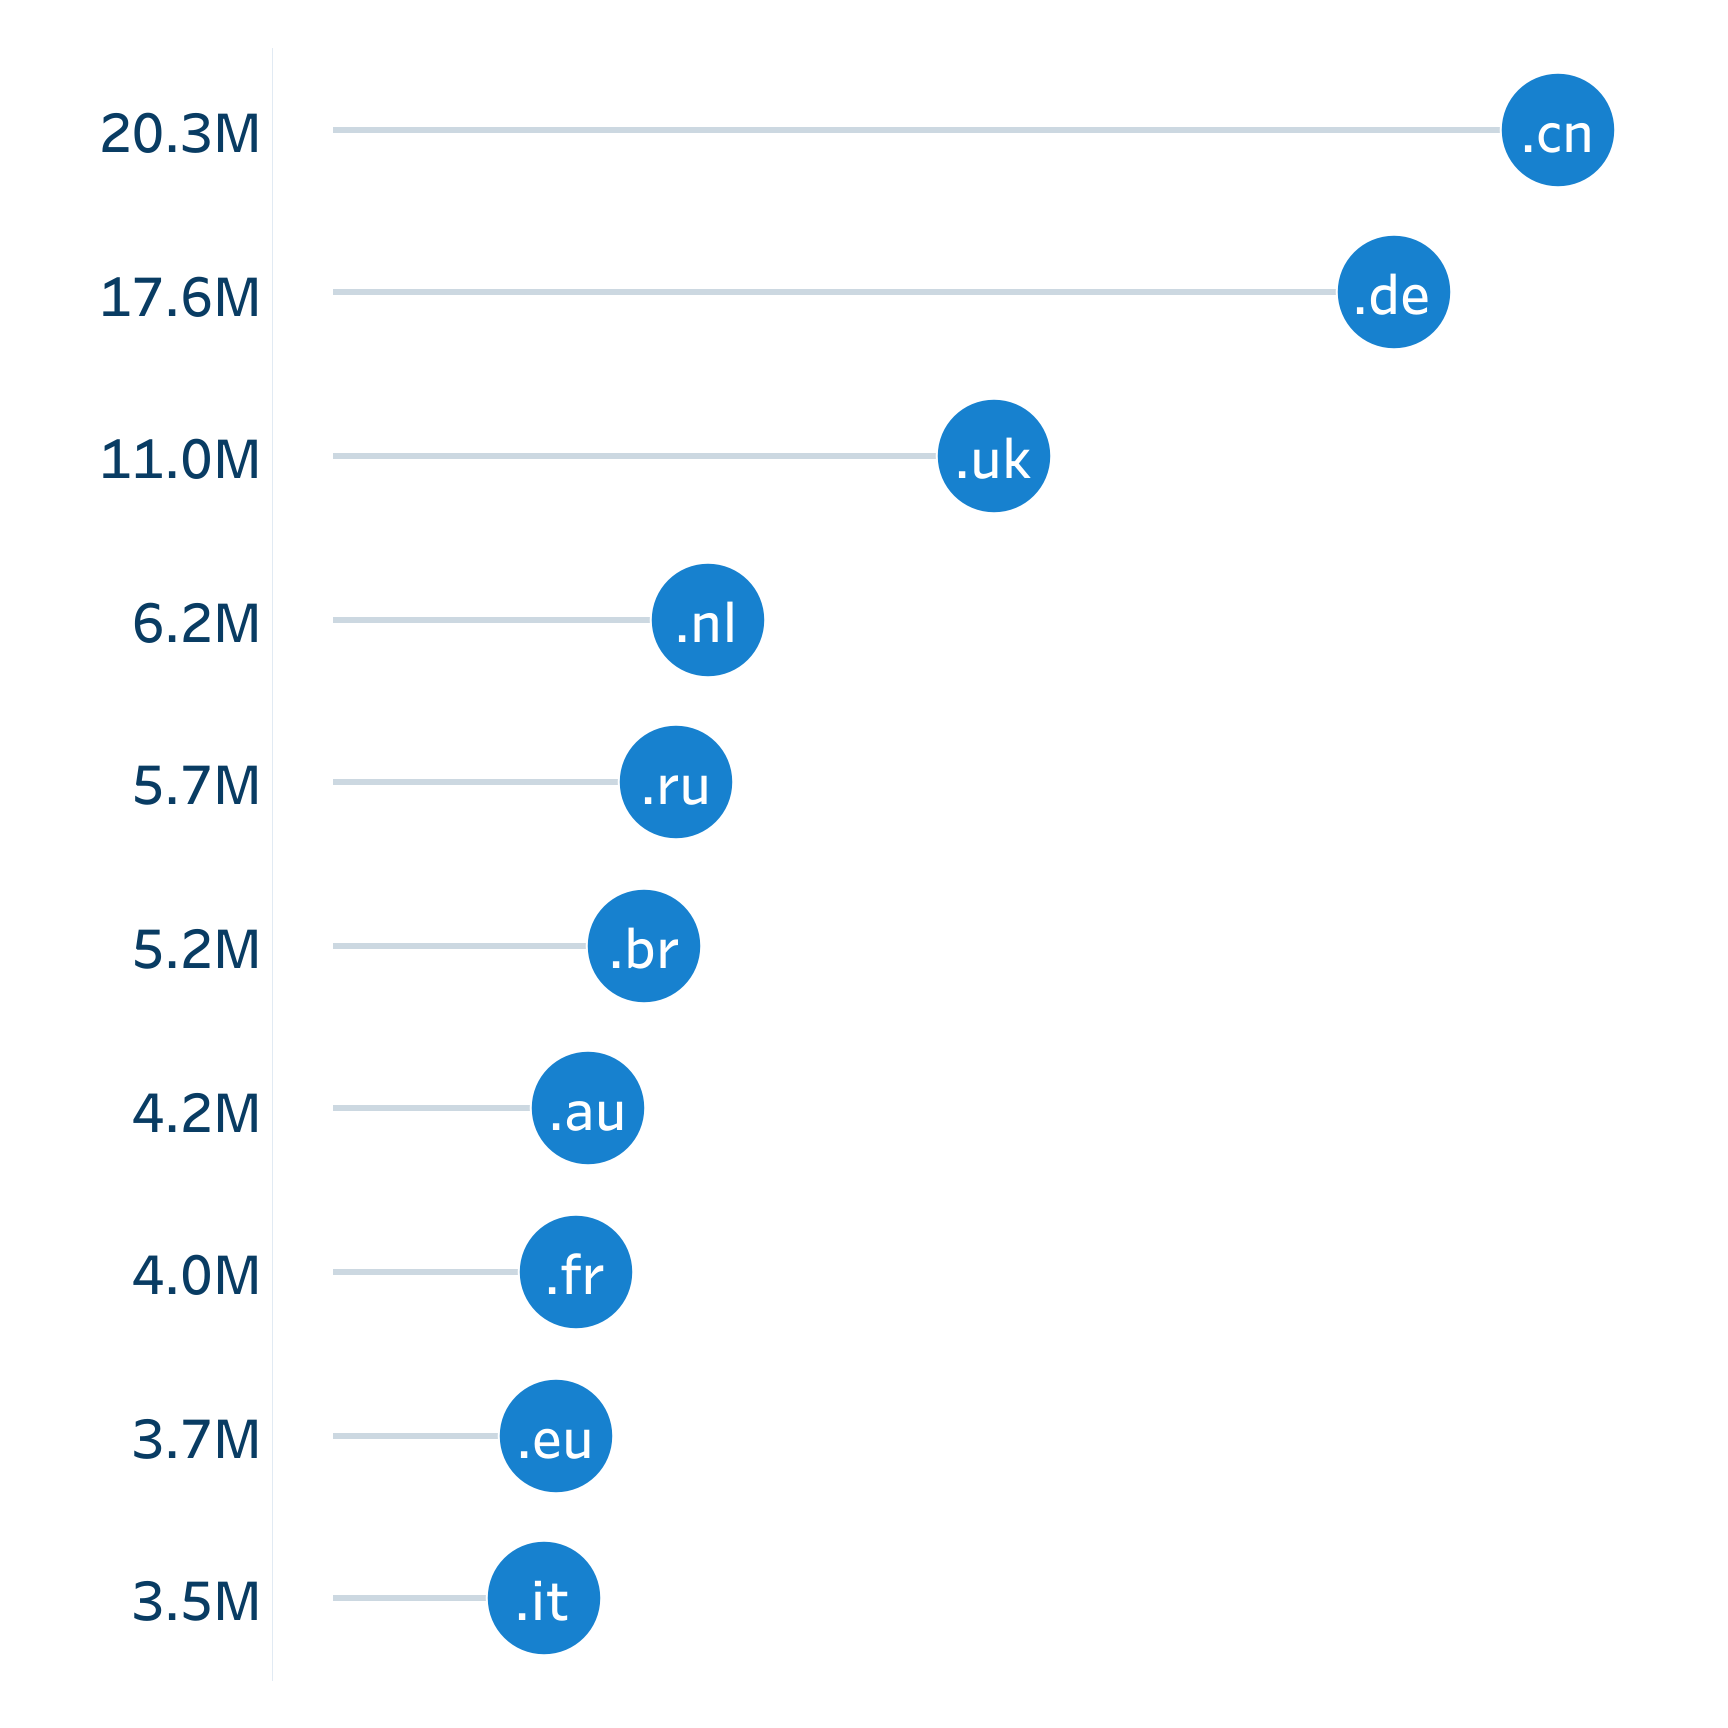
The top 10 ccTLDs, as of June 30, 2023, were .cn, .de, .uk, .nl, .ru, .br, .au, .fr, .eu and .it. As of June 30, 2023, there were 308 global ccTLD extensions delegated in the root zone, including internationalized domain names, with the top 10 ccTLDs comprising 59.4% of all ccTLD domain name registrations.
ngTLDs as Percentage of Total TLDs
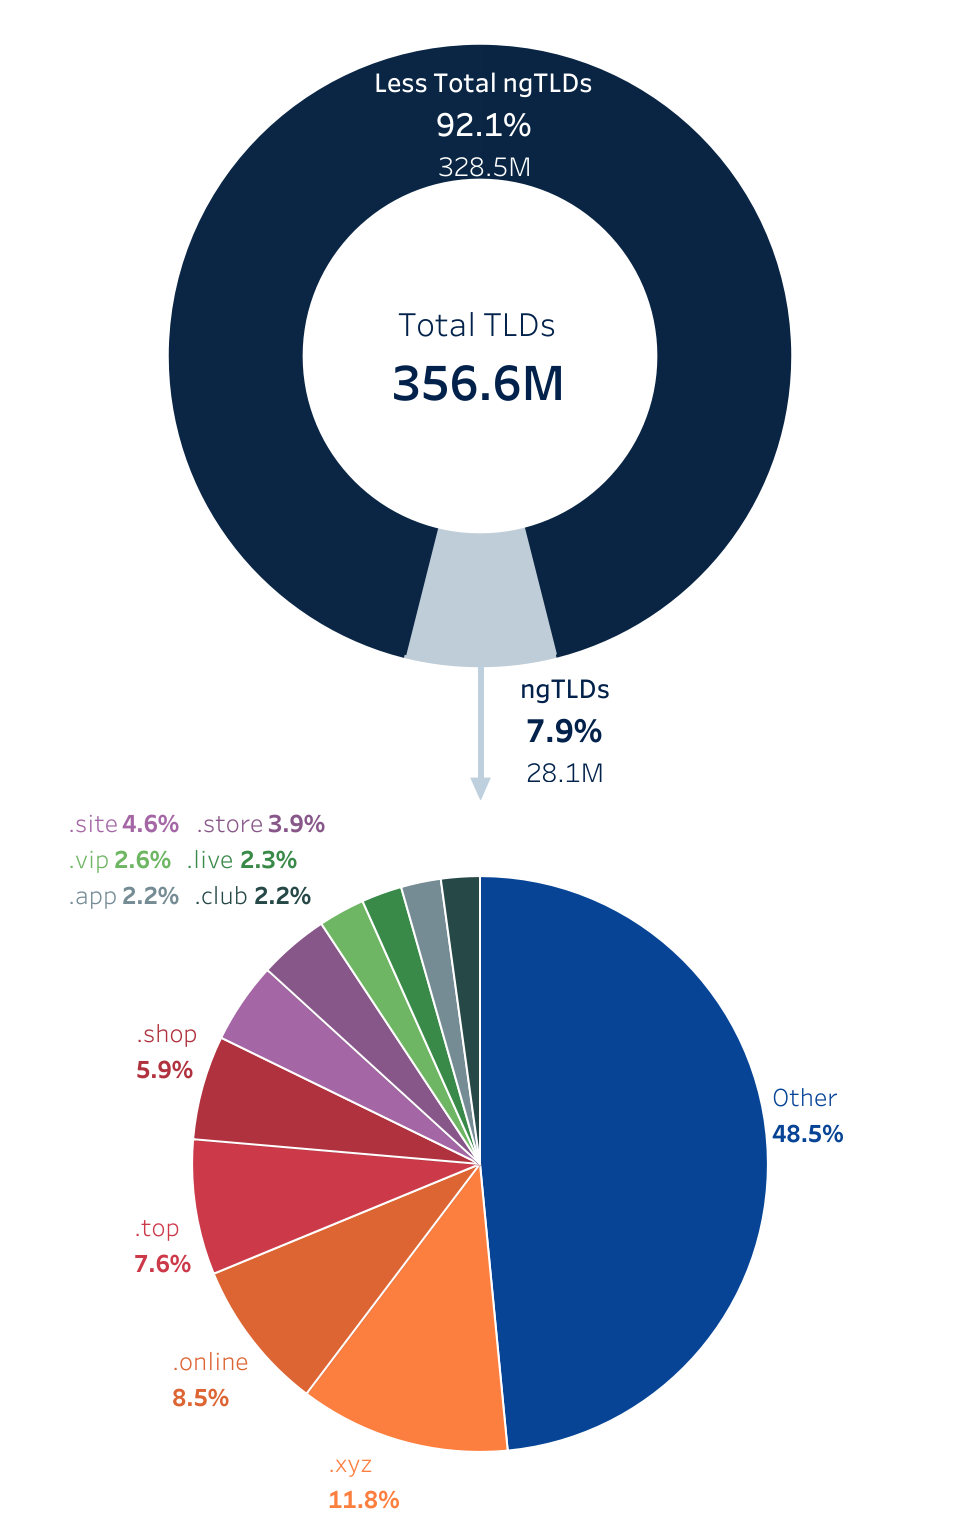
The top 10 ngTLDs represented 51.5% of all ngTLD domain name registrations. The following chart shows ngTLD domain name registrations as a percentage of overall TLD domain name registrations, of which they represent 7.9%. In addition, the chart highlights the top 10 ngTLDs as a percentage of all ngTLD domain name registrations for the second quarter of 2023.
Geographical ngTLDs as Percentage of Total Corresponding Geographical TLDs
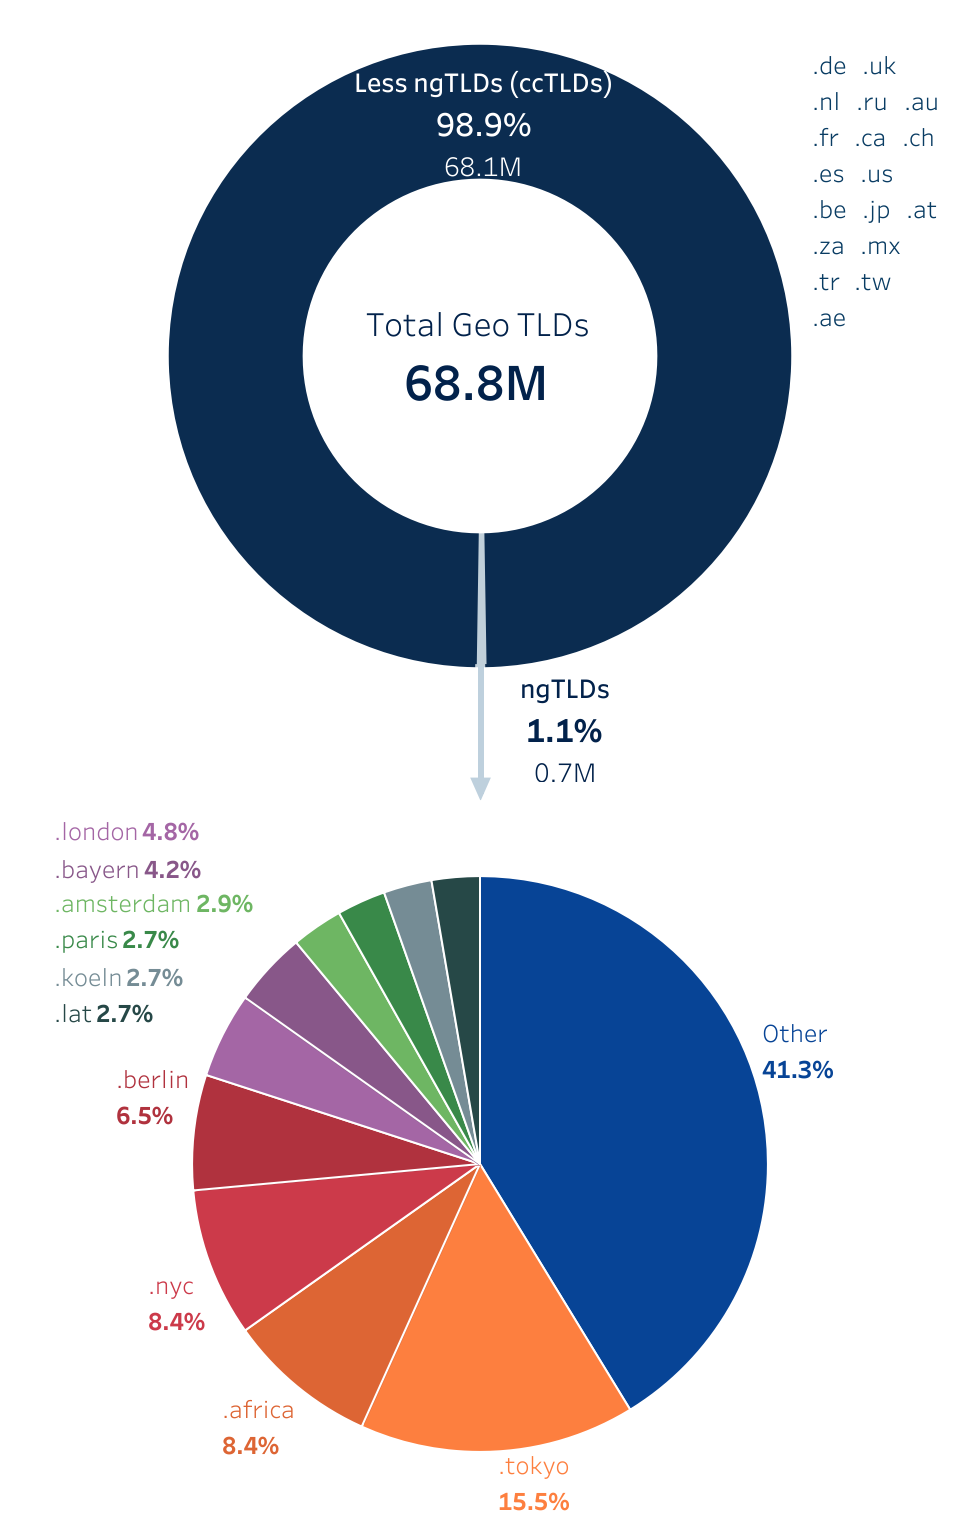
As of June 30, 2023, there were 50 ngTLDs delegated that met the following criteria: 1) had a geographical focus and 2) had more than 1,000 domain name registrations since entering general availability. The chart summarizes the domain name registrations as of June 30, 2023, for the listed ccTLDs and the corresponding geographical ngTLDs within the same geographic region. In addition, the chart highlights the top 10 geographical ngTLDs as a percentage of the total geographical TLDs.
About DNIB.com
DNIB.com, sponsored by Verisign, provides global statistical and analytical research and data on the domain name industry, plus analyses of key policy, security and technology trends. The latest Domain Name Industry Brief Quarterly Report, previous reports and interactive dashboards with expanded domain name industry data are all available at DNIB.com.
Learn More
To access archives for The Domain Name Industry Brief Quarterly Report, please go to https://dnib.com/listing/report. For the online version of this report, detailed interactive dashboards, plus current articles on important DNS topics and analyses, visit DNIB.com. Email your comments or questions to [email protected].
Methodology
For information about the statistical methodology used in creating the Domain Name Industry Brief Quarterly Report and DNIB.com’s dashboards, visit https://dnib.com/methodology.


