
Regional Trends in the Domain Name Industry: Insights Gained Through the ccTLD Lens
There are broader insights to be gained by examining ccTLD trends. But working with this data has its challenges.
Working for Verisign as a domain name industry data analyst, I’m often asked to explore regional demand for domain names. Conducting such research isn’t always a simple task. For instance, .com and .net operate as what the industry calls “thin registries,” meaning the registry does not receive data about domain name registrants or registrant locations. So, I look for other similar data that may provide indirect indicators of demand. The number of domain names registered in a country’s local ccTLD (country code top-level domain) is one dataset I find helpful in trying to understand regional domain demand.
ccTLD data is included in the dashboards published here on the Domain Name Industry Brief (DNIB) website as part of a comprehensive approach to analyzing trends across the Domain Name System (DNS). Given the regional focus of many ccTLDs, the trends we see may also shed light on regional demand for domain names in general. However, there are some unique elements of ccTLD data that are good to understand before reading too much into the raw number of domain names registered.
First, each ccTLD is allocated by the Internet Assigned Numbers Authority (IANA), which is chartered with ensuring globally unique protocol parameter assignment, including management of the root of the DNS and IP address space. However, the countries themselves have the flexibility to decide how their ccTLDs are used. Some have marketed their allocated strings as internationally relevant brands, essentially repurposing a ccTLD to be used like a gTLD (generic top-level domain). While there is no official designation for the list of ccTLDs that have been repurposed for this type of generic use, Google maintains a list of TLDs that do not afford websites any country affinity in search rankings. The DNIB.com dashboards leverage Google’s list to break out such TLDs from region-specific analysis.
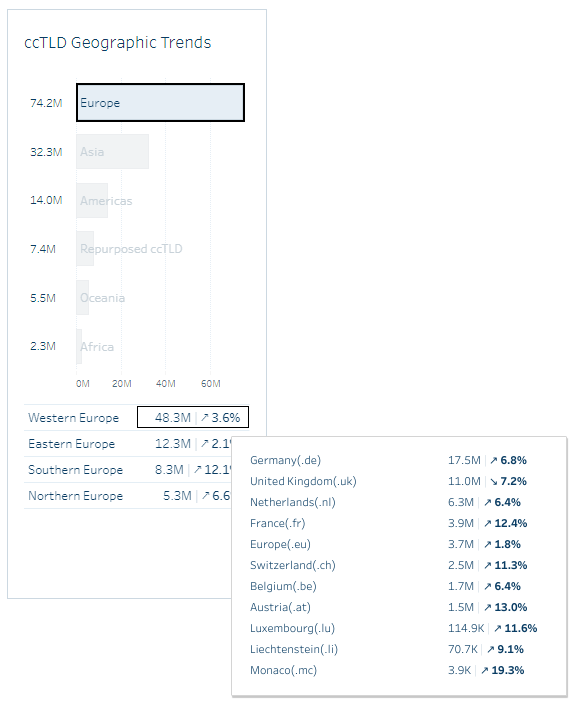
ccTLD highlights from the DNIB’s TLD Trends Overview Dashboard/DNIB.com
Segmenting ccTLDs into regional groups can be helpful in identifying trends within those regions and sub-regions that would be hard to spot when looking at global ccTLDs in aggregate. To create groupings for various regions, we are using the (M49) taxonomy created by the United Nations, a standard for assigning regional groupings for statistical use. For example, between Q2 2019 and Q2 2022, the DNIB dashboards indicate the overall ccTLD base declined by 0.4%. However, looking more closely at regional trends shows that decline is not widespread; in fact, many regions and sub-regions are seeing strong growth. A look at the two largest major regions, Europe and Asia, shows only one sub-region – Eastern Asia – has seen a base decline over this period.
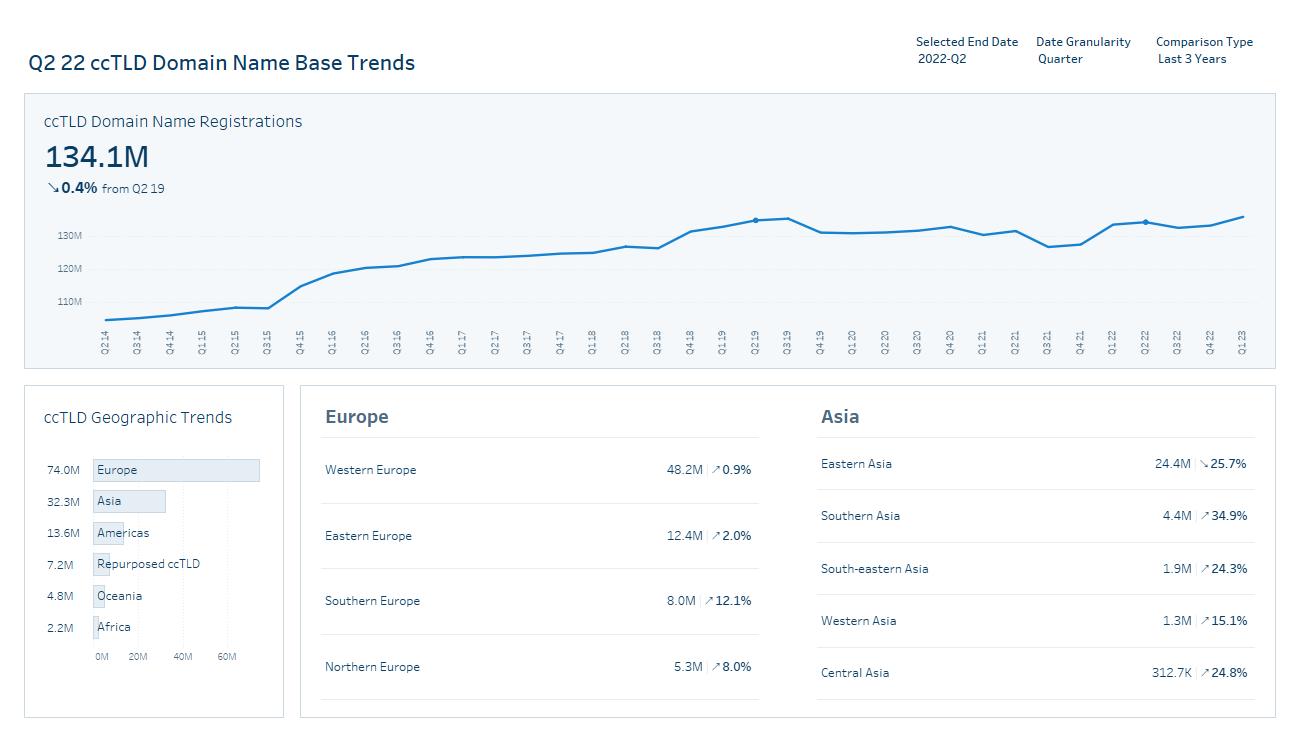
Regional ccTLD trends from Q2 2019 to Q2022, indicating the base decline has been concentrated in Eastern Asia./DNIB.com
Finally, it’s important to note that a key challenge with some ccTLDs can be data availability. The DNIB leverages an industry tracking service, ZookNIC, to navigate ccTLD data collection and standardization processes. Unlike gTLDs, which are required to make details about their domain name base public through a variety of different reporting mechanisms, ccTLDs make independent decisions about what they disclose and how often they disclose it, with no requirements for timing or standardization. Over the last several years, ccTLDs such as .se and .fr began publishing detailed data about their domain name bases in an effort to increase transparency. But of the more than 240 tracked ccTLDs, more than 24 have not indicated a change in their domain name base in the last 2+ years, as of writing this article.
Even with these caveats in mind, ccTLD trends and regional analysis can still provide valuable insights. Over time, analysis at DNIB.com will focus on regions and sub-regions where the segmented data may help us understand important developments – and anomalies that can help us learn about the industry.
More from the DNIB
Internet Trends and Domain Name Registrations
Internet culture, technology trends and evolving terminology can influence the DNS, most recently demonstrated by the rise of AI. DNIB.com’s dashboards help you understand the impact.
Expanding the Number of TLDs Included in Dashboards and Quarterly Reports
The Q2 2023 DNIB Quarterly Report incorporates 16 additional TLDs.